Posted 23 May 2017
As you may recall from previous posts, I have been collaborating with my long-time friend and mentor John Jenkins on the idea to use square-wave modulation of the charging station IR beam to suppress ‘flooding’ from ambient IR sources such as overhead incandescent lighting and/or sunlight.
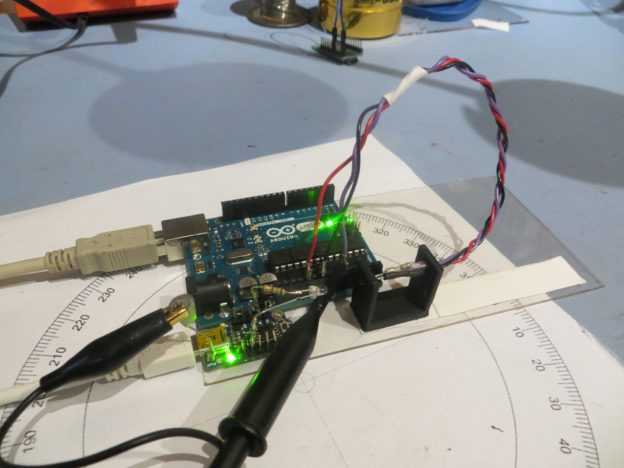
More than likely, If it is possible to implement a software processing algorithms to recover steering information from potentially corrupted data, it will have to be housed on a dedicated processor. So, I decided to set up a separate test setup using two processors – one to generate a square-wave modulation waveform, and another to receive that waveform through an IR link. The link can then be modified in a controlled way to simulate link losses and/or ‘flooding’. The initial hardware setup is shown below.

Initial test bed verification using 12cm separation
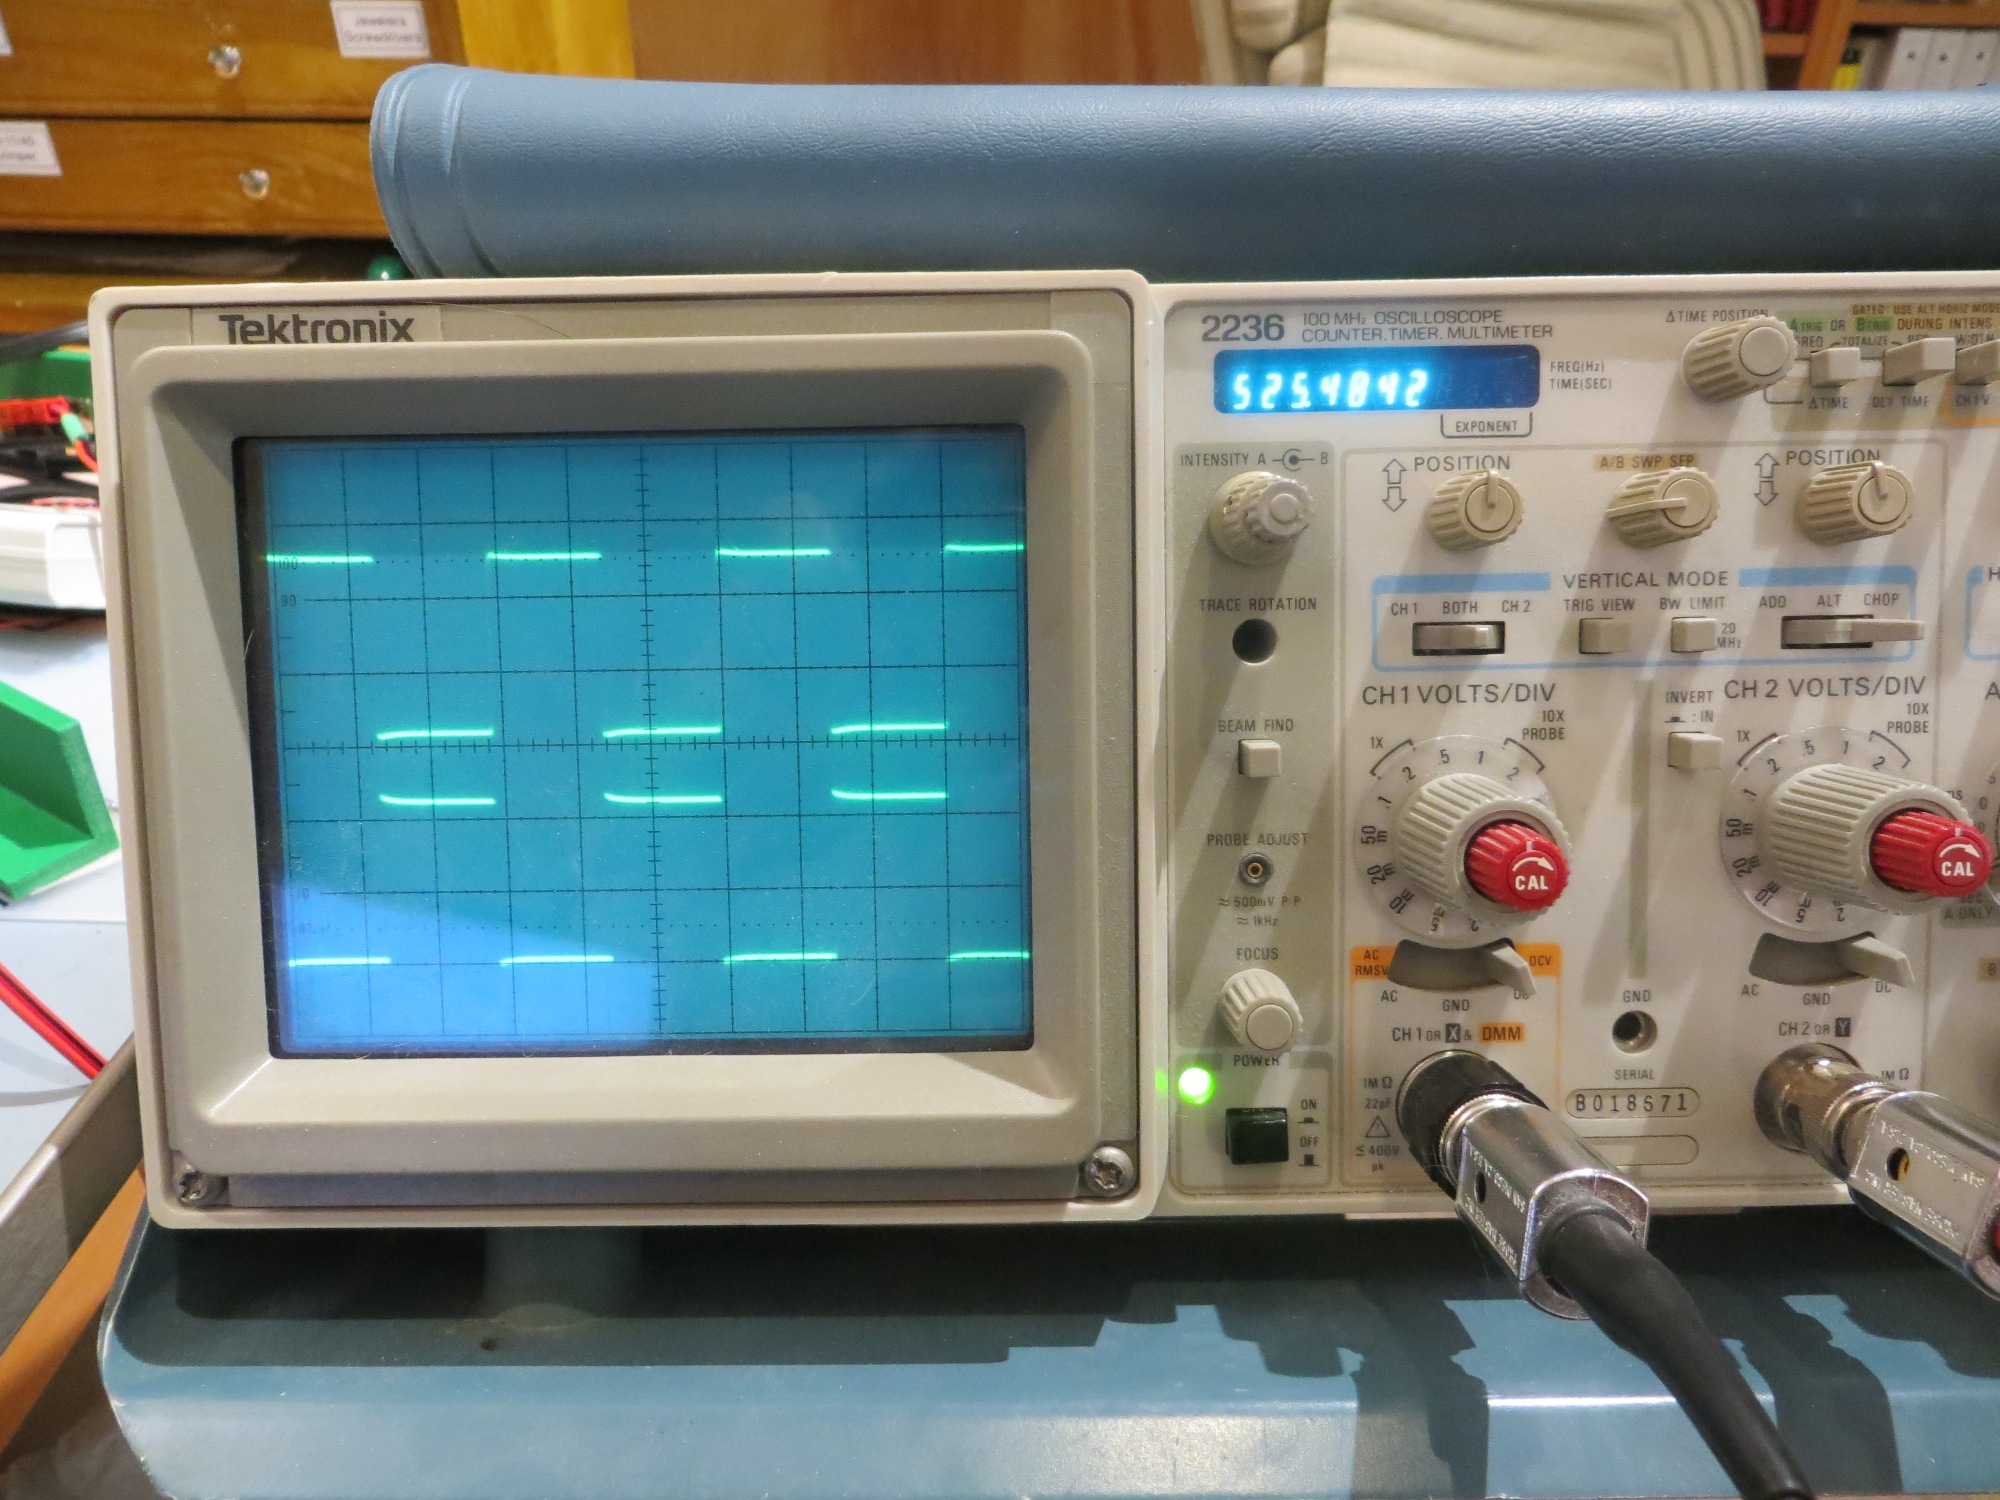
Scope shot showing transmitted and received waveforms, 12cm separation
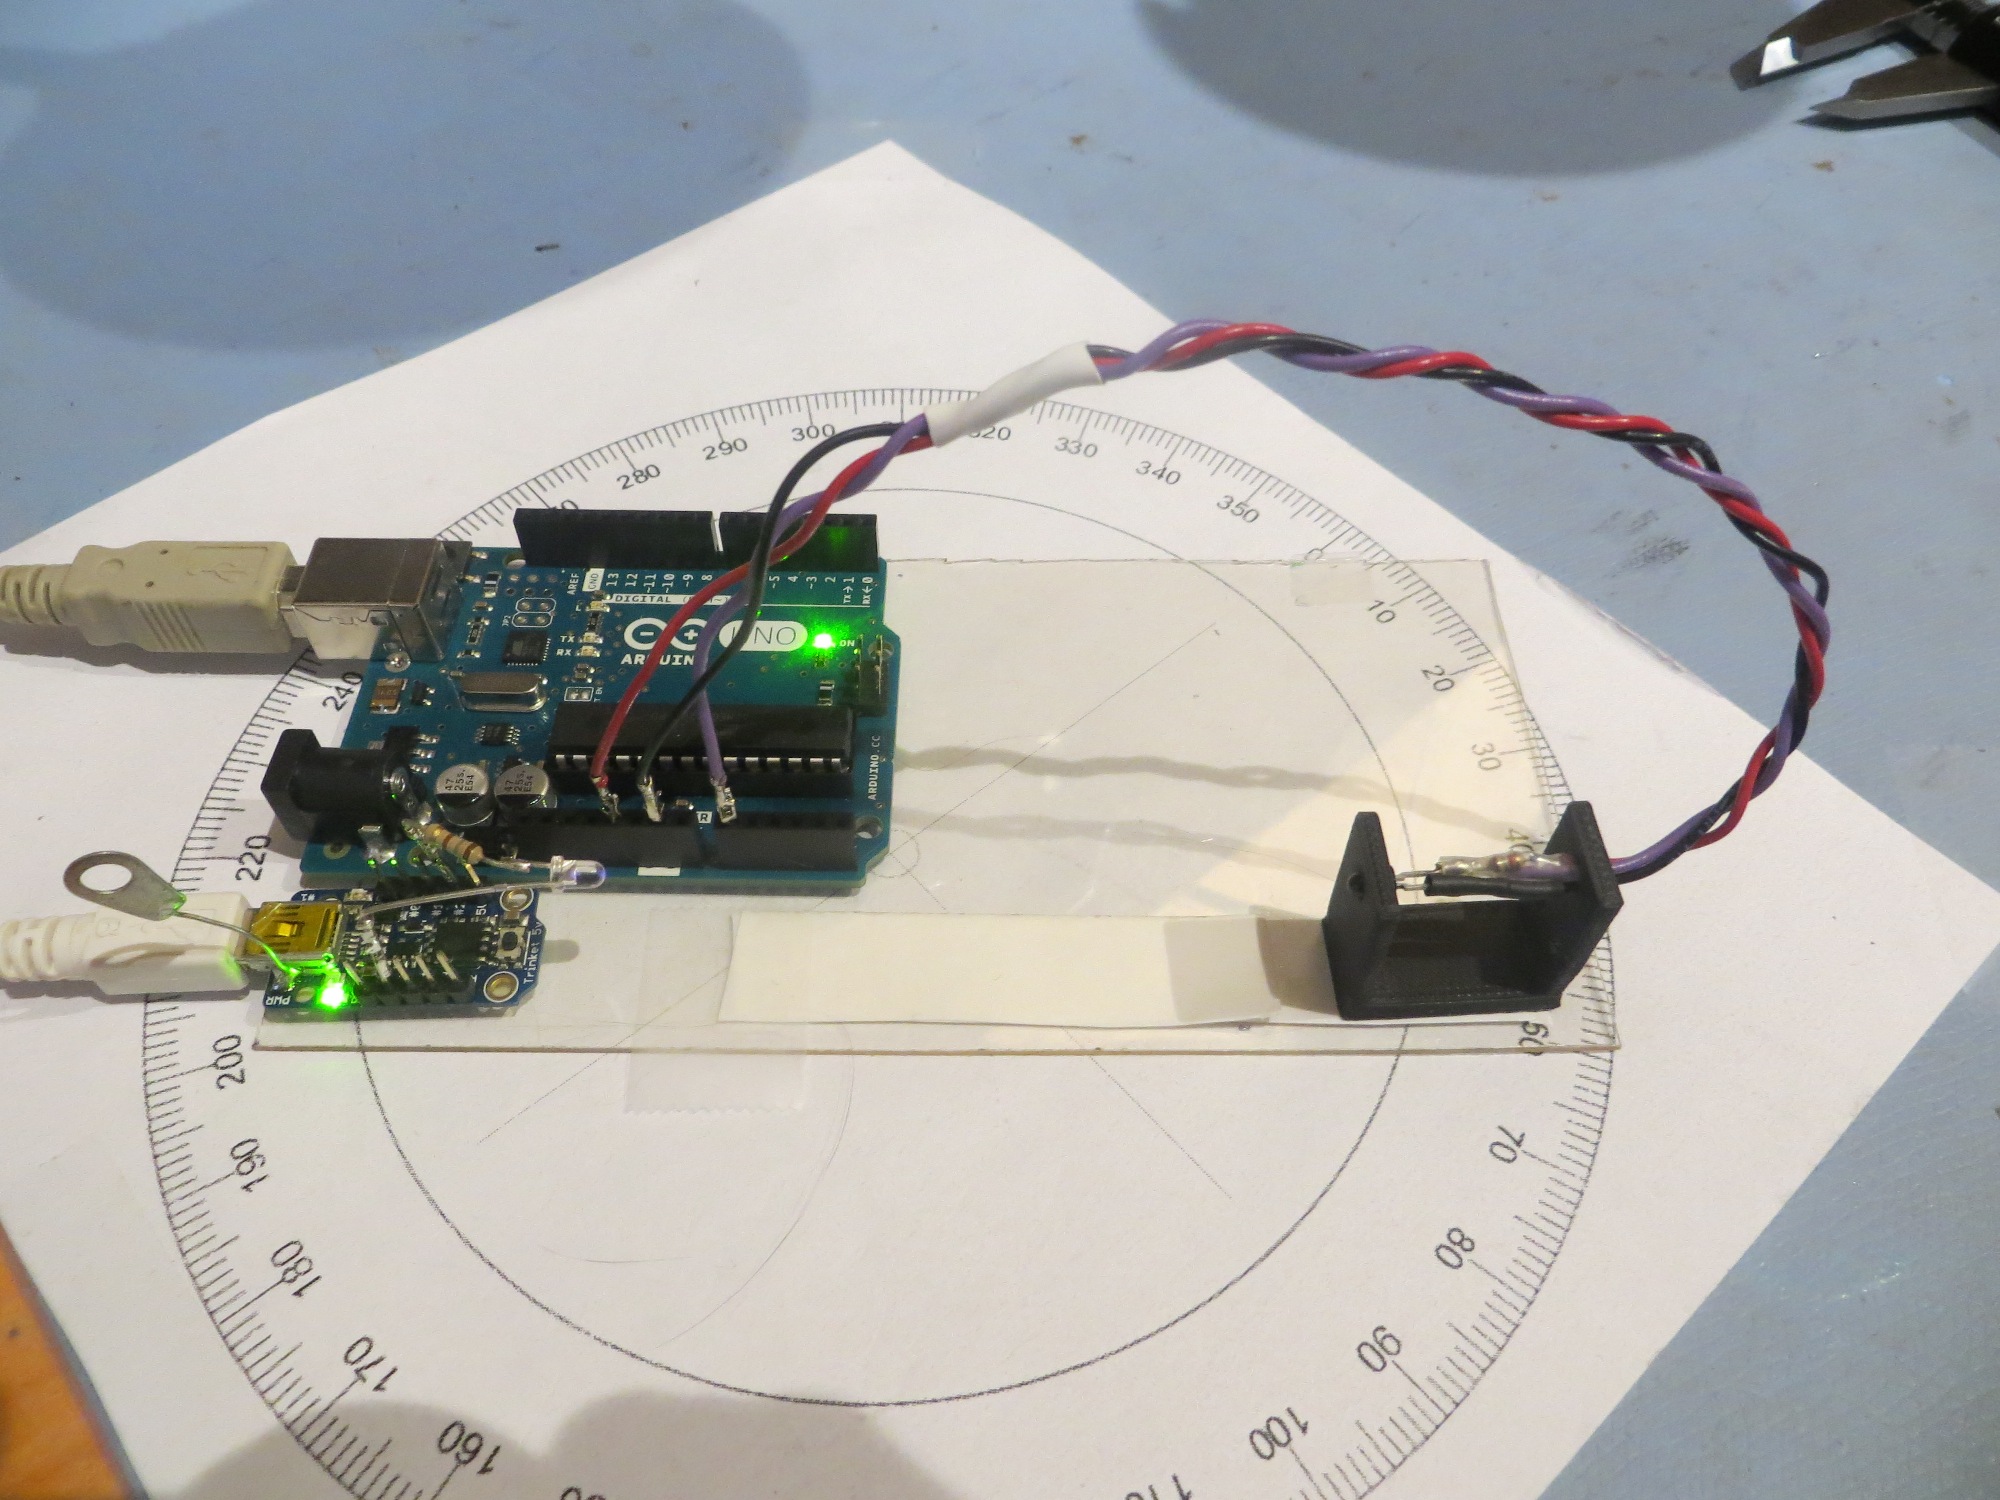
Algorithm test bed with IR link range set to 78cm
Then I ran my little test program on the receiver processor that simply acquires 100 samples at roughly 20 samples/cycle and then prints out the results. The following two images are Excel plots of the results for 12cm & 78cm separation.
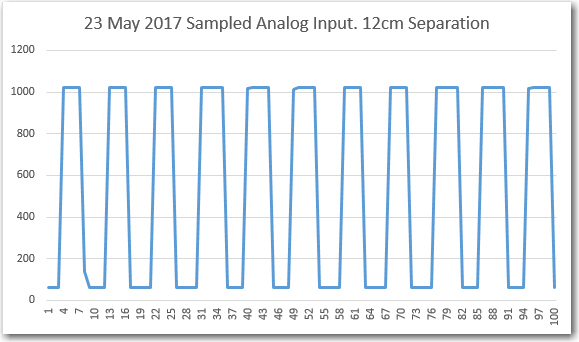
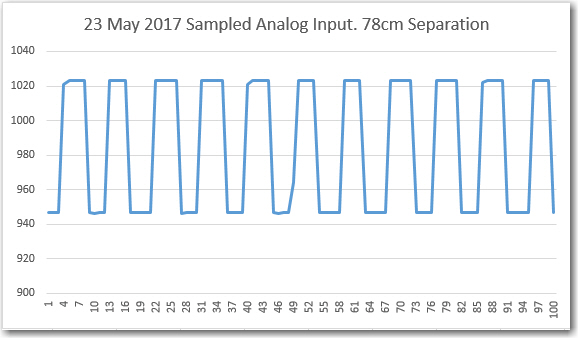
As can be seen from these two plots, the 12 & 78cm separation values provide a reasonably good simulation of the ‘very good’ and ‘reasonably crappy’ signal conditions.
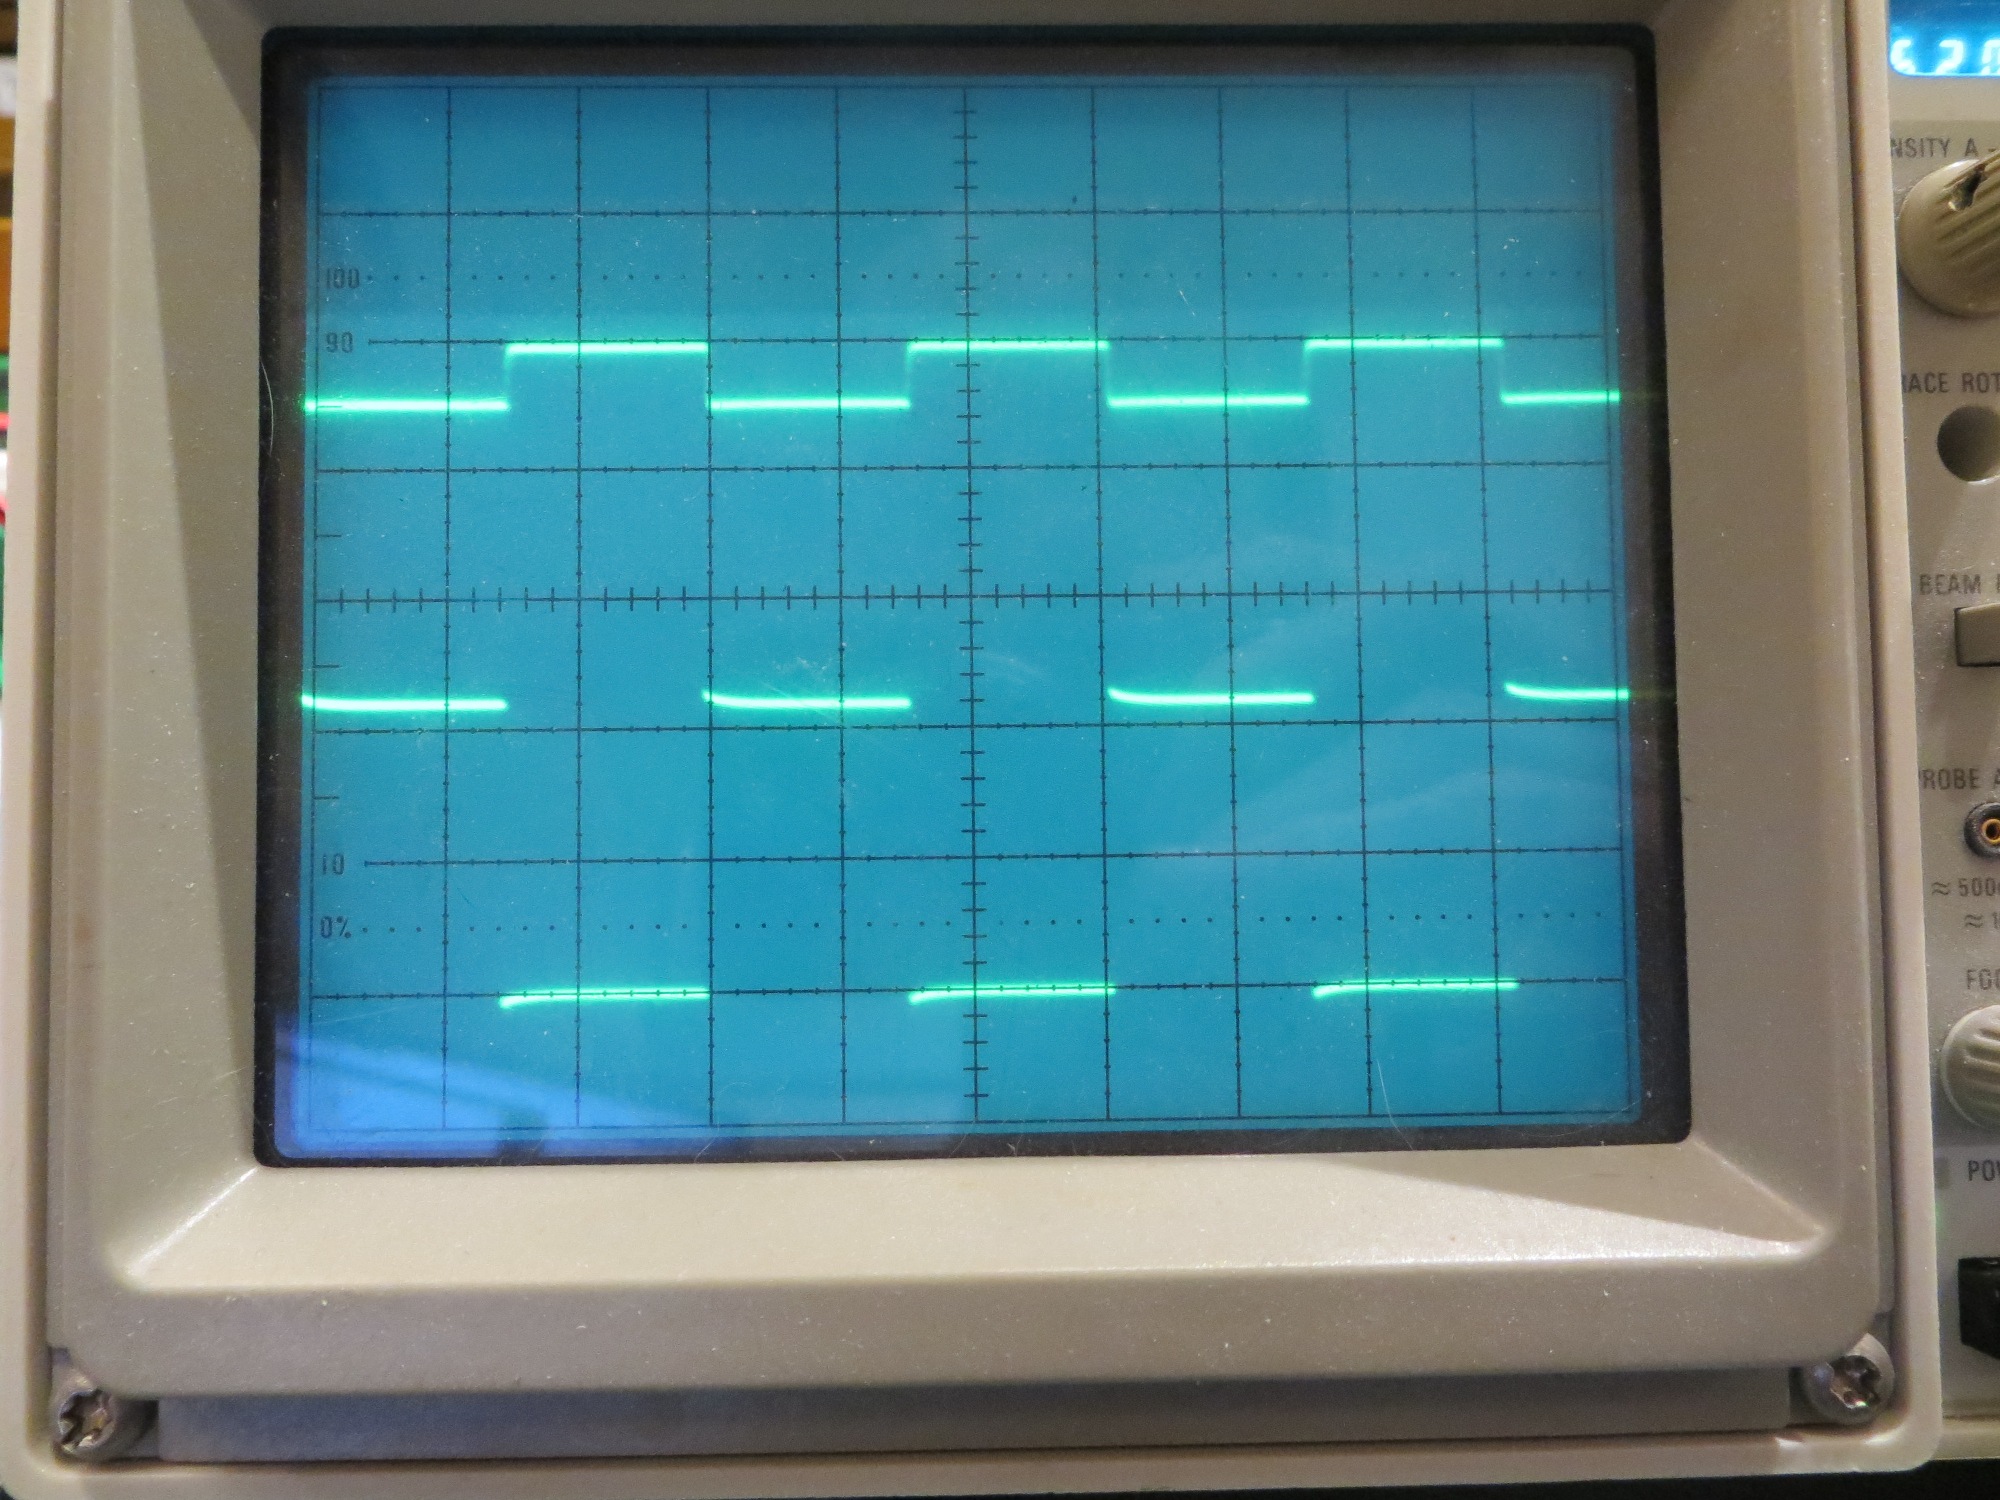
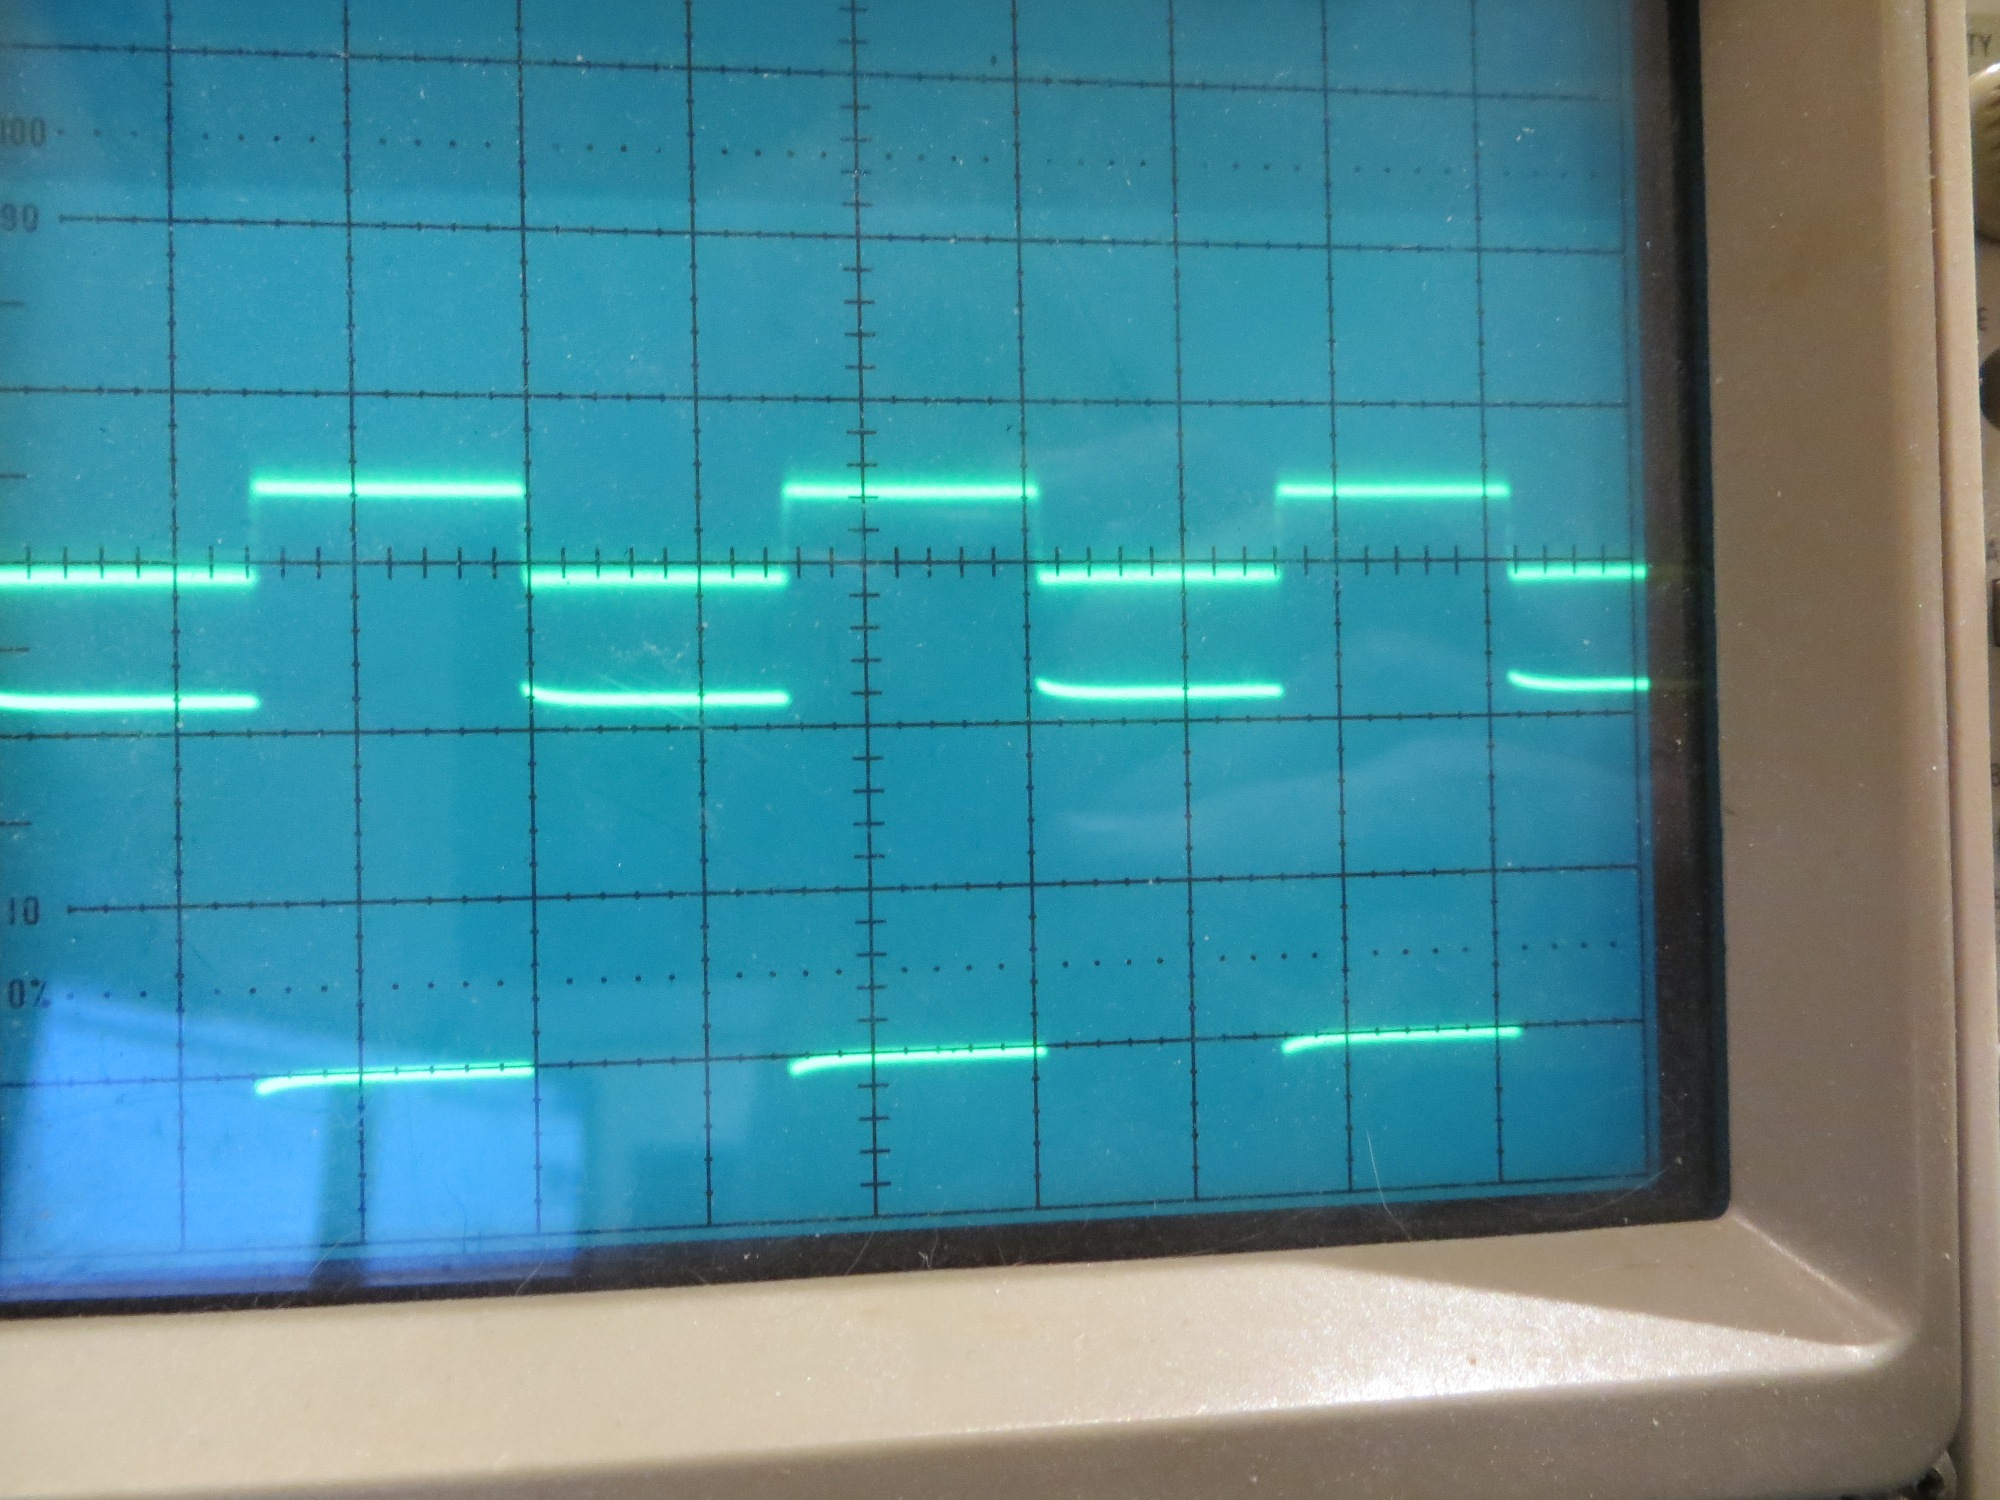
Next I verified that I can successfully ‘flood’ the receiver with my portable battery-operated IR signal generator. I monitored the transmitted and received waveforms, without and then with flooding. In both cases, the bottom trace is the 5V square-wave transmitted signal, shown at 2V/div, and the top trace is the received signal shown at 1V/div. The ground for both traces is the same line on the scope screen.
78cm separation, no flooding signal. Bottom trace is transmit @ 2V/cm, top is receive @ 1V/cm, ground for both is same line
78cm separation, with flooding signal. Bottom trace is transmit @ 2V/cm, top is receive @ 1V/cm, ground for both is same line
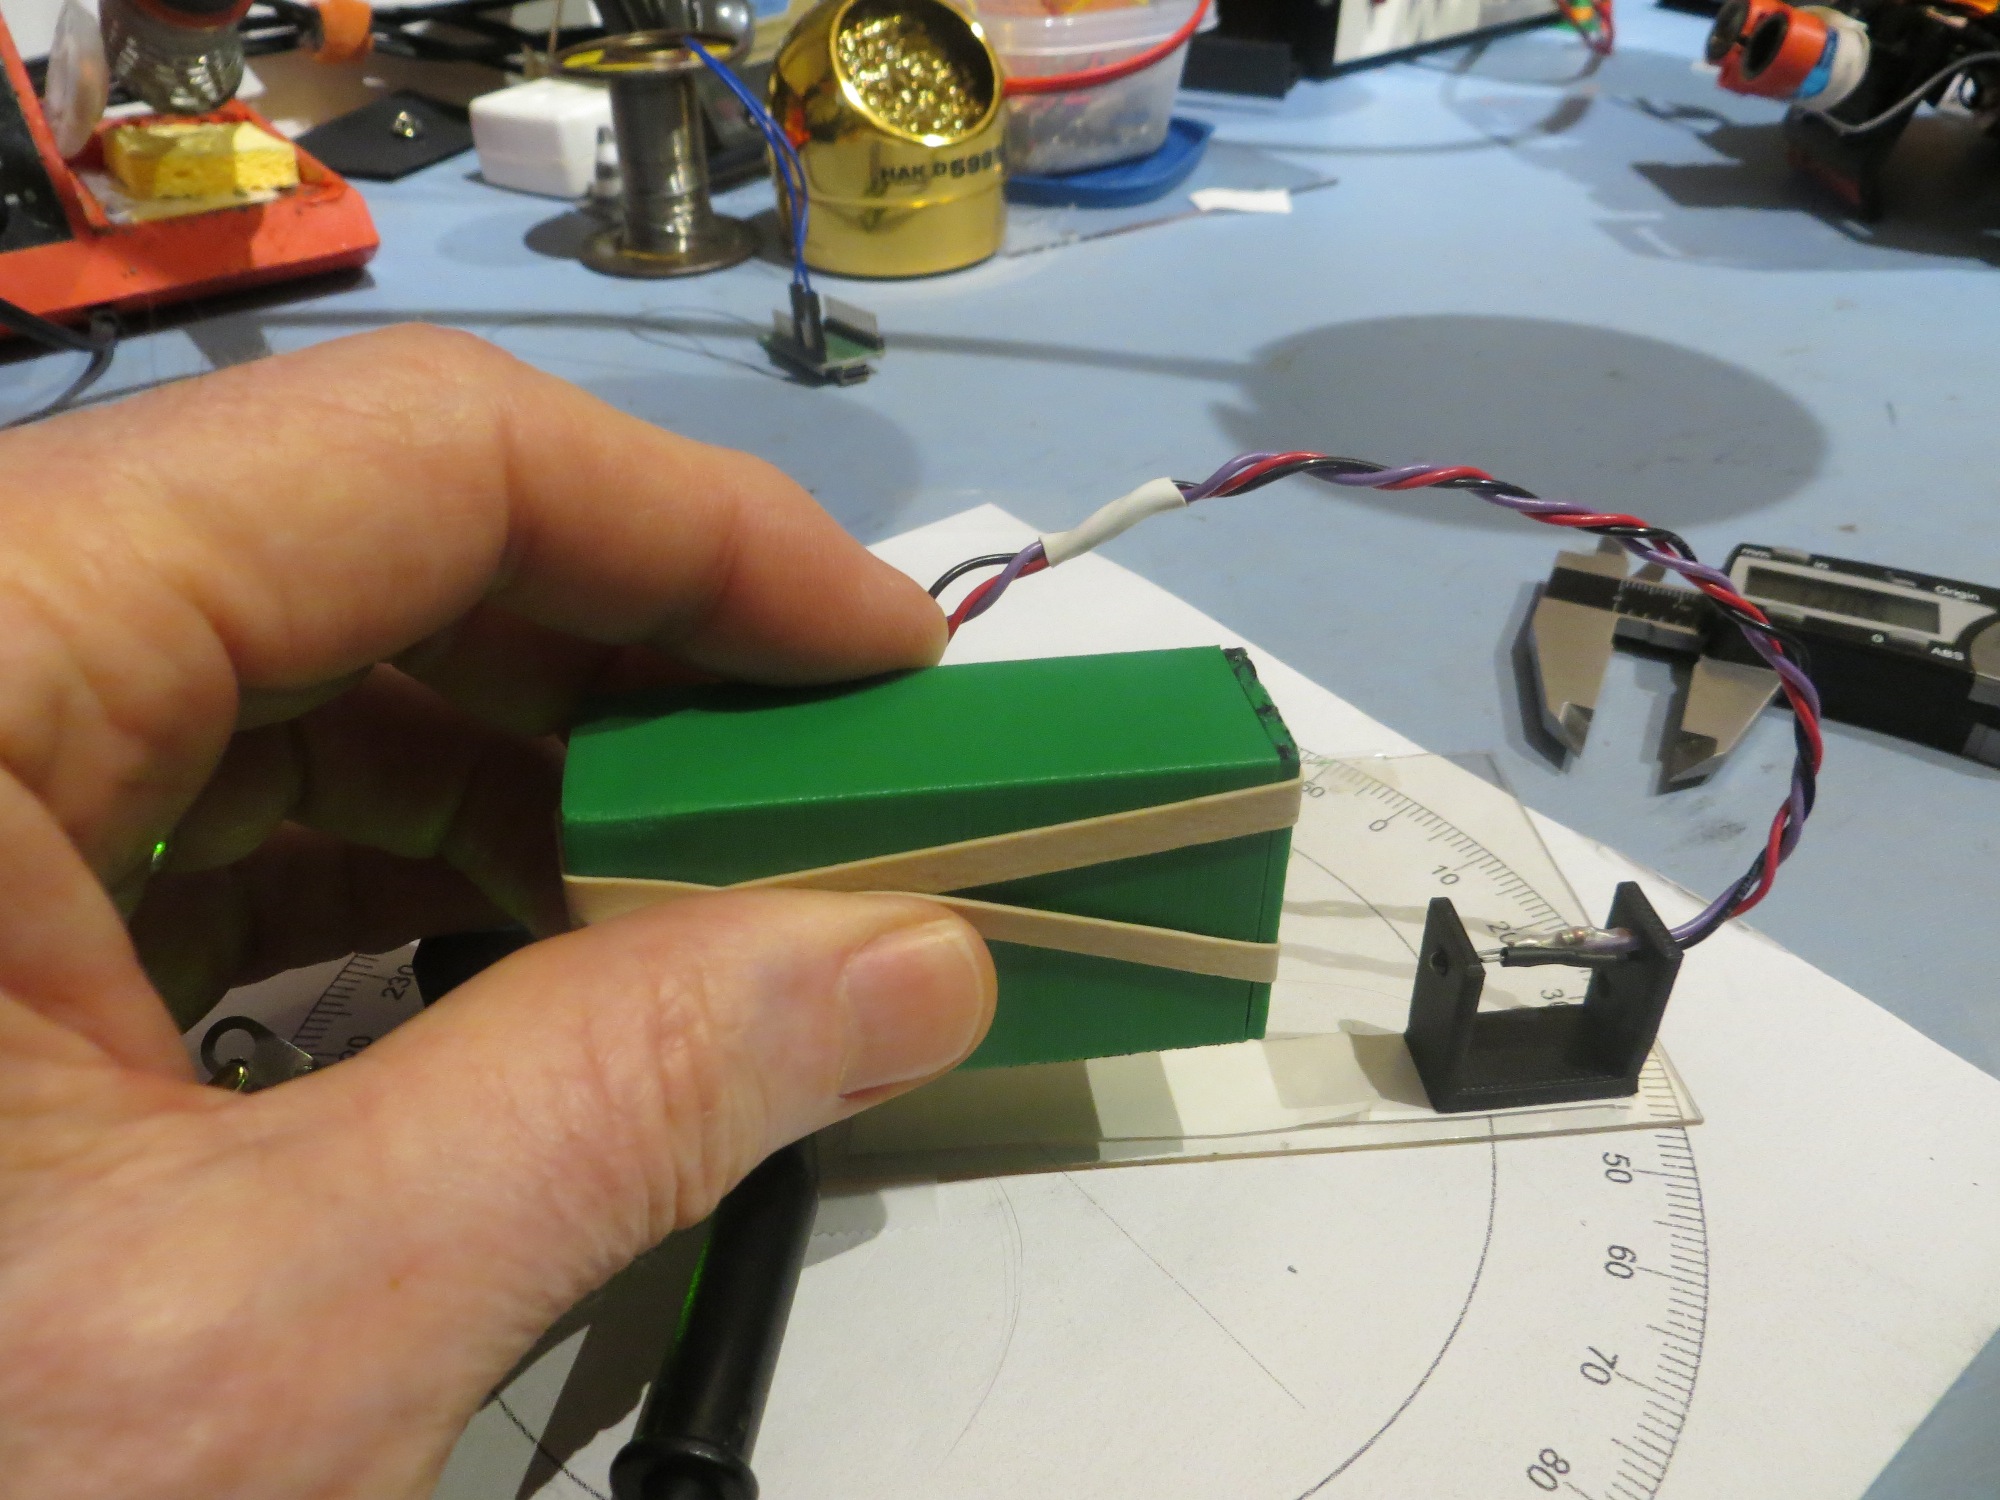
Applying flooding signal with battery-operated IR signal generator
As can be seen in the scope photos, I can indeed produce almost 2V of ‘flooding’ using the IR signal generator, so I should be able to determine whether or not a particular recovery algorithm is successful at suppressing flooding effects.
Stay tuned
Frank